NV Energy - Energy Usage Plotter
General Commentary
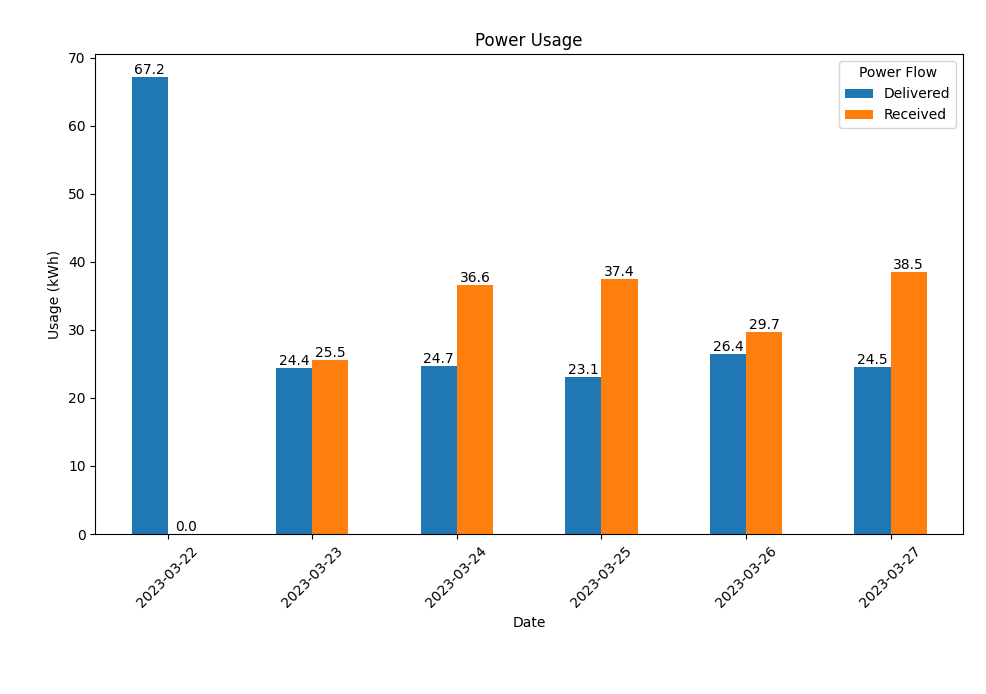
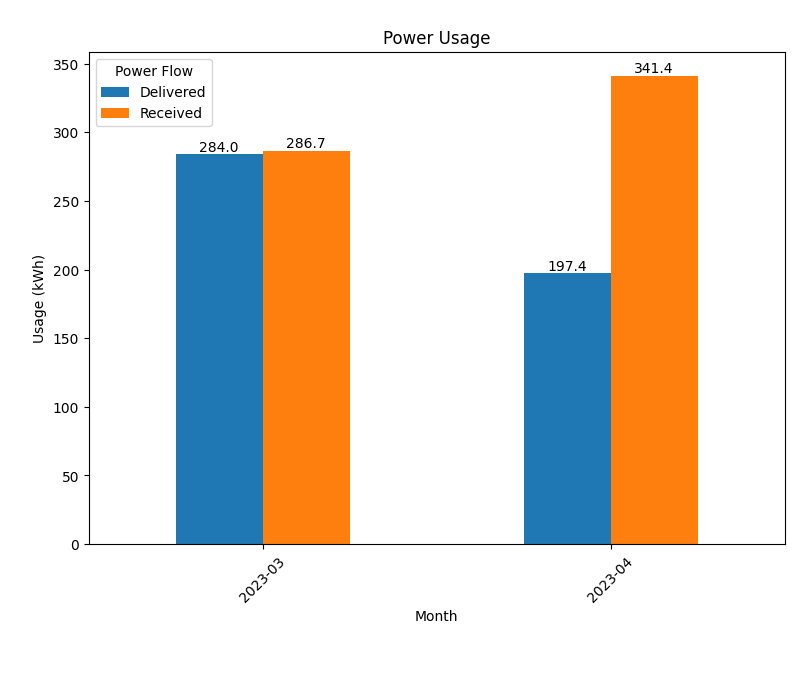
Focused on simplicity, this application does exactly as it sounds. Input a file name via either the terminal or the config file and the application will spit out a CSV with filtered/grouped data, an image of the graph, and a live graph presented by Matplotlib.
As with any Matplotlib graph, the live graph can be modified in terms of sizing and dimensions and then saved as well.
This application is meant to be a nice-to-have utility and nothing more.
Description
Built with the use of the Pandas and Matplotlib, the application is concise and simple. Simply read in the file, filter down to only the needed columns, group the values into the proper period types, and output the data back to files and a graph.
The end user can pass the file name and period grouping level in via either the config file or from the terminal. Using the terminal allows for multiple inputs to be graphed (as individual graphs).